To view this message as a word file, click here.
To view this message as a pdf file, click here.
- Exchange Rate Development
A strengthening of the shekel alongside a strengthening of the dollar worldwide.
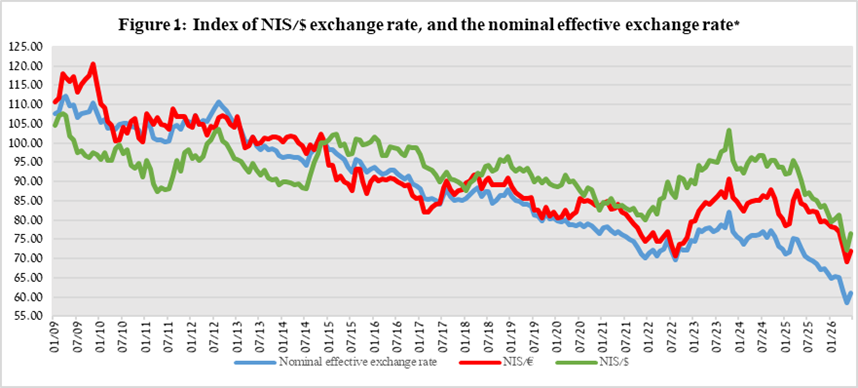
In the second quarter of 2026, the shekel strengthened by approximately 5.9 percent against the US dollar and by about 6.6 percent against the euro. In addition, the shekel strengthened by about 6.1 percent against the currencies of Israel's main trading partners, in terms of the nominal effective exchange rate (i.e., the trade-weighted average shekel exchange rate against those currencies).
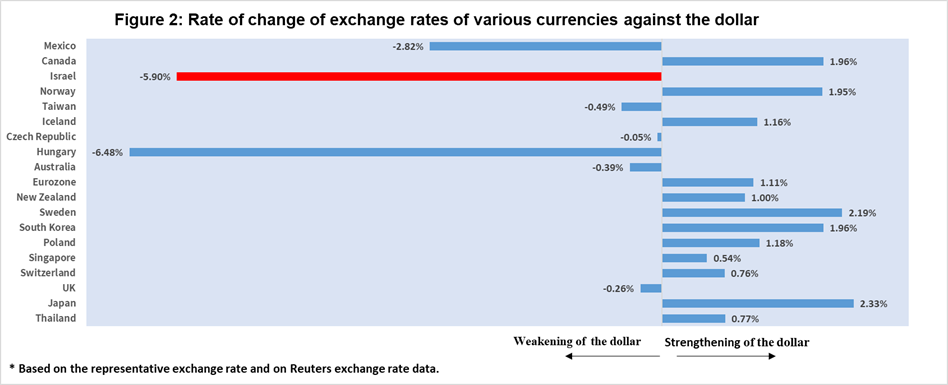
During the second quarter, the US dollar strengthened against most of the major currencies (Figure 2), including by about 2.3 percent against the Japanese yen and about by 2 percent against the Canadian dollar
- Exchange Rate Volatility
Increase in actual volatility alongside an increase in implied volatility
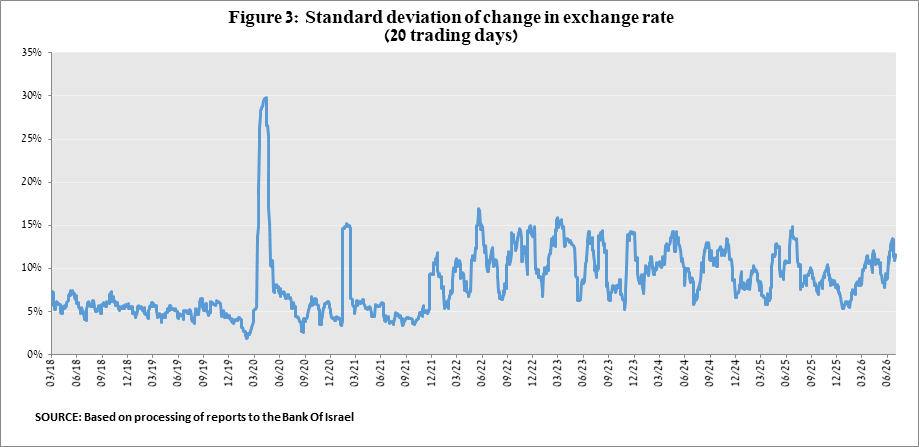
The average actual standard deviation of changes in the shekel/dollar exchange rate, which represents its actual volatility, increased by 2.3 percentage points during the quarter, to an average level of 10.7 percent.
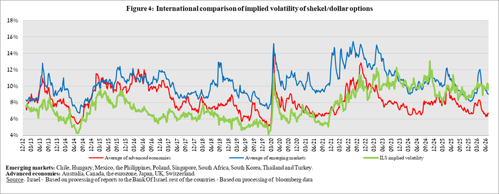
The average implied volatility in over-the-counter shekel/dollar options—those traded outside the stock exchange—which is an indication of expected exchange rate volatility, increased by 0.2 percentage points, to an average level of about 9.9 percent at the end of the quarter. This is alongside the average level of implied volatility in foreign exchange options in emerging markets, which increased by 0.4 percentage point compared to the previous quarter, to 10.0 percent at the end of the quarter. In contrast, there was a decline of 0.7 percentage points in the average level of implied volatility in advanced economies, to 7 percent at the end of the quarter (Figure 4).
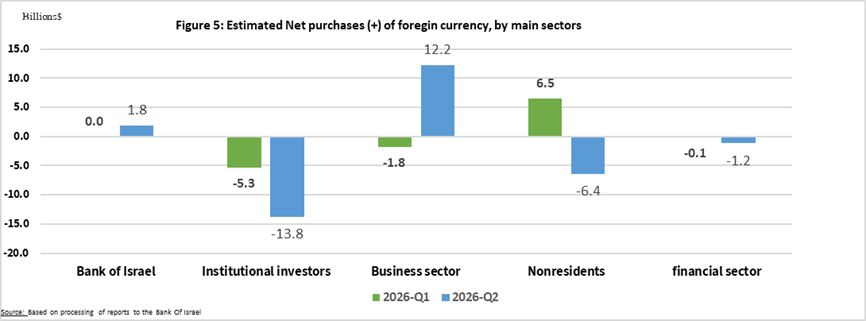
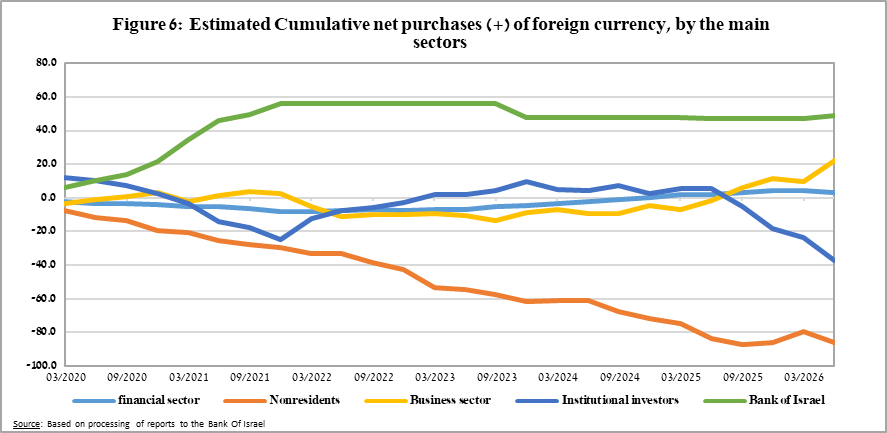
An estimate of activity by the main segments in the foreign exchange market indicates a change in the composition of activity in the second quarter. During the quarter, there were significant net foreign exchange purchases by the business sector, while nonresidents transitioned from net foreign exchange purchases to net sales. Institutional investors increased their net foreign exchange sales, while the activity of the financial sector remained relatively moderate.
The institutional investors—pension funds, provident funds, and insurance companies—increased their net foreign exchange sales to about $18.3 billion during the quarter, compared with sales of about $5.8 billion in the previous quarter.
The business sector moved to net foreign exchange purchases, totaling about $12.2 billion in the second quarter, compared to sales of about $1.8 billion in the previous quarter.
Nonresidents moved to net foreign exchange sales of about $6.4 billion, compared with net purchases of about $6.5 billion in the previous quarter.
The financial sector (mainly the banks) increased its net foreign exchange sales to about $1.2 billion in the second quarter, compared with net sales of about $0.1 billion in the previous quarter.
The Bank of Israel made net foreign exchange purchases of about $1.8 billion during the second quarter.
- Trading Volume in the Foreign Currency Market—Tables and Figures
Trading volume vis-à-vis the domestic banking system[3]
The average daily trading volume increased by about 8.9 percent during the second quarter, to $17.6 billion, with most of the increase coming from swap transactions and spot and forward transactions.
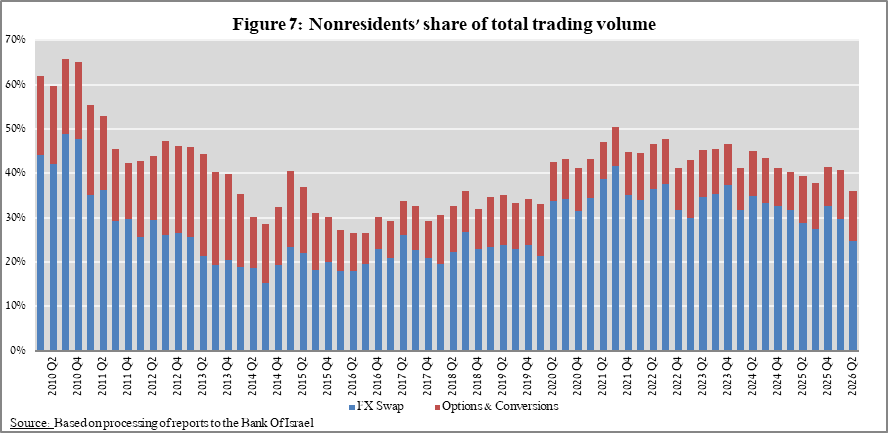
Nonresidents' share of total trading volume vis-à-vis the domestic banking system (spot and forward transactions, options, and swaps) declined by about 4.5 percentage points to about 36.2 percent at the end of the second quarter.
|
Forex transactions with domestic banks, by instruments and derivatives ($ million) |
||||||
|
|
|
Conversions (1) |
Swaps1 (2) |
Cross Currency swap2 (3) |
Options3 (4) |
Total volume of trade (1)+(2)+(3)+(4) |
|
Second quarter 2026 (Not final) |
Total |
281,131 |
685,735 |
1,857 |
35,844 |
1,004,566 |
|
Daily average (57 days) |
4,932 |
12,030 |
33 |
629 |
17,624 |
|
|
Nonresidents |
105,279 |
248,274 |
1,008 |
8,957 |
363,518 |
|
|
of which Foreign financial institutions |
104,406 |
248,274 |
1,008 |
8,846 |
362,534 |
|
|
Residents |
175,851 |
437,461 |
849 |
26,887 |
641,048 |
|
|
of which Real sector |
59,654 |
69,787 |
479 |
15,165 |
145,086 |
|
|
Financial sector |
48,647 |
176,081 |
59 |
1,807 |
226,594 |
|
|
Institutions (incl. insurance companies) |
39,109 |
139,285 |
0 |
6,216 |
184,610 |
|
|
Individuals |
7,904 |
3,318 |
0 |
90 |
11,312 |
|
|
Other4 |
873 |
0 |
0 |
111 |
985 |
|
|
Domestic banks5 |
11,876 |
20,747 |
81 |
2,959 |
35,663 |
|
|
First quarter 2026 |
Total |
257,625 |
692,740 |
3,002 |
33,456 |
986,823 |
|
Daily average (61 days) |
4,223 |
11,356 |
49 |
548 |
16,177 |
|
|
Nonresidents |
97,993 |
294,023 |
1,075 |
9,110 |
402,200 |
|
|
of which Foreign financial institutions |
97,179 |
294,023 |
1,075 |
9,075 |
401,352 |
|
|
Residents |
159,632 |
398,718 |
1,927 |
24,346 |
584,623 |
|
|
of which Real sector |
53,182 |
56,154 |
324 |
13,981 |
123,640 |
|
|
Financial sector |
46,022 |
160,996 |
212 |
655 |
207,886 |
|
|
Institutions (incl. insurance companies) |
32,852 |
141,964 |
0 |
6,295 |
181,111 |
|
|
Individuals |
6,827 |
2,321 |
0 |
151 |
9,298 |
|
|
Other4 |
814 |
0 |
0 |
35 |
849 |
|
|
Domestic banks5 |
12,035 |
20,475 |
305 |
2,482 |
35,297 |
|
|
1 Only one leg of the swap, i.e., the nominal value of the transaction (in accordance with the BIS definition) |
||||||
|
2 The exchanged founds through Cross Currency Swap transactions considered for the volume, as one leg only in cases where the two legs offset each other. |
||||||
|
3 The national value, that includes purchases and sales of put and call options. |
||||||
|
4 Including other entities such as portfolio managers, nonprofit organizations, national institutions, and those not included elsewhere. |
||||||
|
5 Total interbank trade, divided by 2 |
||||||
Estimated total trading volume[4]—domestic banking system and foreign reporting entities
The estimated total activity in transactions against the shekel, as reflected in reports from the domestic banking system and foreign reporting entities, indicates that nonresidents’ share of trading volume in spot and forward transactions (excluding swaps and options) was about 87 percent in the second quarter.
Trade between nonresidents constituted about 77 percent of the volume, which had a daily average of about $23.4 billion.
|
|
|
Relative share of total trading volume |
|
|
||
|
|
|
Trade between nonresidents |
Trade between a nonresident and a resident1 |
Trade between the domestic banking system and residents |
Total volume ($ million) |
Daily average ($ million) |
|
2026-Q2 |
Trading volume in spot and forward transactions |
77.4% |
9.7% |
12.9% |
1,336,842 |
23,453 |
|
Trading volume in swap and options transactions |
54.6% |
18.2% |
27.2% |
1,698,363 |
29,796 |
|
|
2026-Q1 |
Trading volume in spot and forward transactions |
78.6% |
9.4% |
12.0% |
1,295,597 |
21,239 |
|
Trading volume in swap and options transactions |
55.9% |
20.2% |
23.9% |
1,774,935 |
29,097 |
|
|
1 Trade between a nonresident and a resident includes: (a) reports by foreign reporting entities regarding transactions with residents; and (b) reports by domestic banks regarding transactions with nonresidents. |
||||||
[1] For additional information on the segments’ activity in the foreign exchange market, see “Statistical Bulletin” 2024—Chapter D.
[2] The main segments presented do not make up the entire market. For additional information, see the section on “The Database of Foreign Exchange Market Activity” in the Bank of Israel’s “Statistical Bulletin” for 2024.
[3] From the beginning of 2020, the data do not include branches of foreign banks in Israel.
[4] Total trading volume is an estimate of total activity in transactions against the shekel, based on reports by the domestic banking system and by foreign reporting entities.