To view this message as a word file, click here.
To view this message as a pdf file, click here.
The following is a summary of developments in nonfinancial private sector debt in the second quarter of 2026:
- The increase in the balance of nonfinancial private sector debt (both business and household) continued, and in the second quarter of 2026, it increased by approximately 3.6 percent to a level of about NIS 2.6 trillion.
- The balance of business sector debt increased by about 4.2 percent during the second quarter, to about NIS 1.7 trillion. This was mainly due to net debt raised, which was concentrated in bank credit.
- In the second quarter of the year, the business sector issued about NIS 33 billion in bonds, half of which were issued in June. This volume is higher than the average quarterly funds raised in the past four quarters.
- The balance of household debt also continued to increase during the quarter, to about NIS 935 billion. This was due to an increase in the balance of nonhousing debt (by about NIS 9 billion, 3.6 percent) to about NIS 260 billion, to all main lending institutions including the banks, the credit card companies, and the institutional investors; The balance of housing debt also continued to increase (about NIS 13 billion, 1.9 percent) which was due to new mortgage borrowing from banks.
The nonfinancial business sector’s[1] debt
- In the second quarter of 2026, the balance of business sector debt continued to increase, by about NIS 67 billion (4.2 percent) to about NIS 1.7 trillion. The increase in the balance was due to net debt raised in all channels, totaling about NIS 79 billion, made up mostly of bank credit, while there was a prominent increase of nonbank credit in the tradable bonds in Israel channel. Bank credit during the quarter was issued mainly to the financial services sector, which includes credit to secure transactions in derivatives and securities loans. There was also an increase in credit to the construction and real estate segment. An increase of about 1.3 percent in the CPI[2] also contributed to the increase in the value of CPI-indexed debt. These increases were partly offset by the shekel’s appreciation of 5.9 percent against the US dollar, which reduced the value of the debt denominated in and indexed to foreign currency.
- Due to these impacts, the annual growth rate of the balance of business sector debt continued to expand in the quarter, to about 13.8 percent, a trend that began in the second half of 2024, after a slowdown in the two preceding years. This increase was mainly impacted by the continued expansion of the balance of bank debt, the growth rate of which was about 19 percent, while the annual growth rate in the nonbank debt balance rose to about 6.6 percent, and remains lower than the annual growth rate of bank debt (Figures 1, 2).
- In the second quarter of the year, the business sector issued about NIS 33 billion in bonds, half of which were issued in June. This volume is higher than the average quarterly funds raised in the past four quarters (about NIS 23 billion). About 52 percent of the issues in the quarter were by companies in the real estate and construction industry, the industry that continues to lead in funds raised, as in previous years (Figure 3).
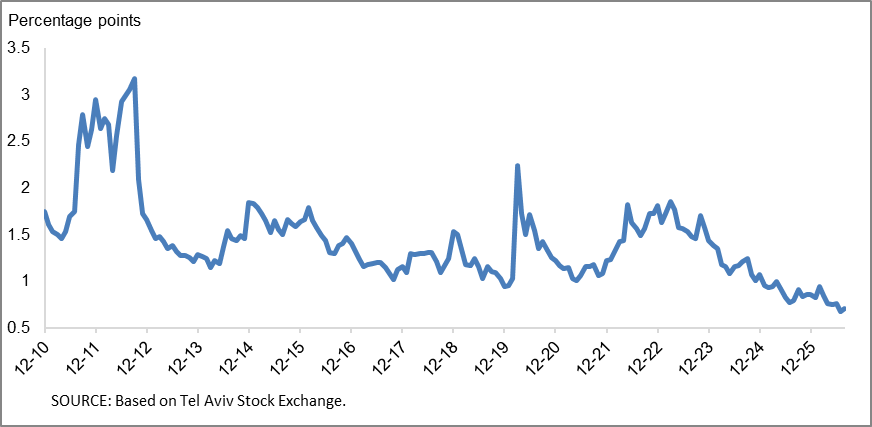
- In the second quarter of 2026, the spread[3] between yields on corporate bonds that are included in the Tel Bond 60 Index and the yields on CPI-indexed government bonds continued to narrow, to about 0.76 percentage points. This contraction continued into July–August, to about 0.7 percentage points (Figure 4).
Table 1: The Composition of Business Sector Debt
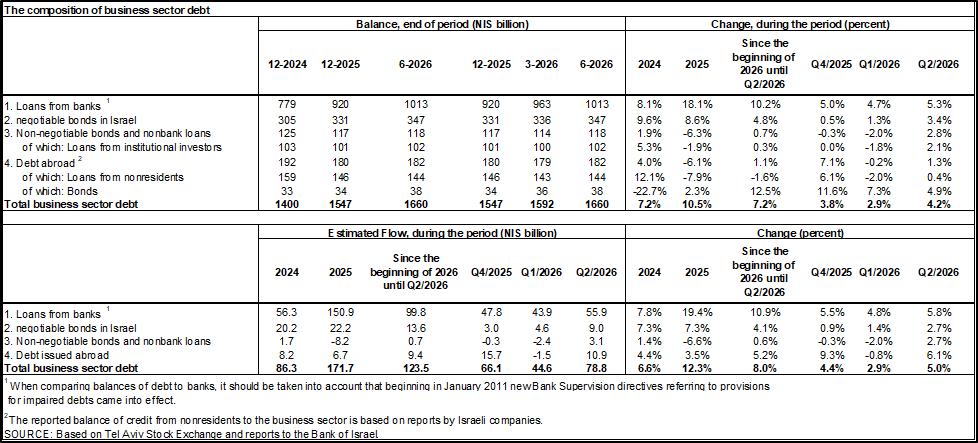
Figure 1: Estimated Net Quarterly Quantitative Change in Business Sector Debt
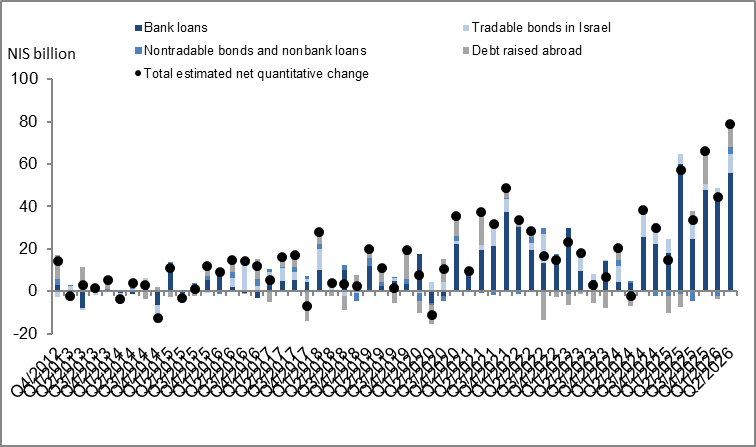
Figure 2: Rate of Change (Year on Year) in the Business Sector's Bank and Nonbank Debt
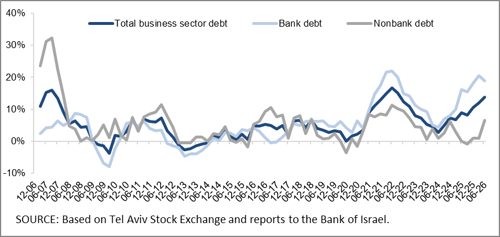
Figure 3: Nonfinancial Business Sector Bond Issuance during the quarter, by Industry
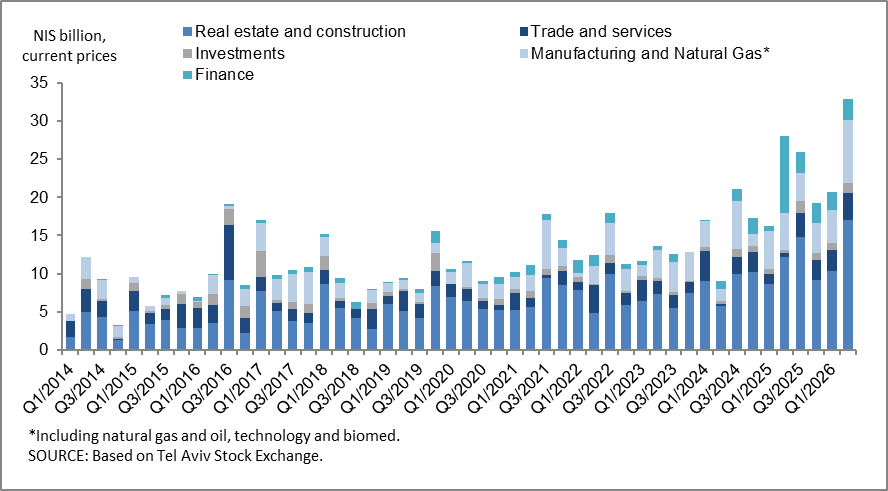
Figure 4: Spread between Indexed Corporate Bonds (Tel-Bond 60) and Indexed Government Bonds (monthly average)
Household debt
- In the second quarter of 2026, the balance of households’ outstanding debt continued to increase, to about NIS 935 billion—an increase of about NIS 22 billion (2.4 percent). The increase in the balance of nonhousing debt was particularly prominent, as this component grew by 3.6 percent to about NIS 260 billion, following a decline of 0.1 percent in the first quarter. This increase encompassed all main lenders, including the banks, the credit card companies, and the institutional investors. Housing debt continued to increase (about NIS 13 billion, about 1.9 percent) to about NIS 675 billion, mostly to banks.
- Due to these effects, the annual growth rate of nonhousing debt increased to about 10 percent, compared with 5.7 percent in the previous quarter. In contrast, the annual growth rate of housing debt remained stable at about 7 percent (Figure 5).
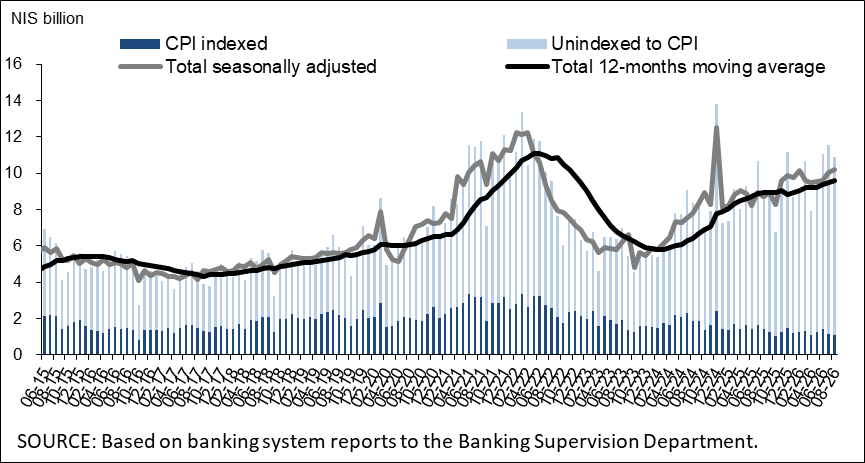
- The increase in housing debt is the result of continued new mortgage borrowing from the banks, totaling about NIS 29 billion in the second quarter of the year, after seasonal adjustment—similar to the quarterly average of new mortgage volume in the previous four quarters.
- In July–August 2026, the volume of new mortgage borrowing from the banks, after seasonal adjustment, reached a monthly average of about NIS 10 billion, similar to the monthly average during the second quarter of 2026 (Figure 6).
Table 2: Outstanding Debt Balances of Households1
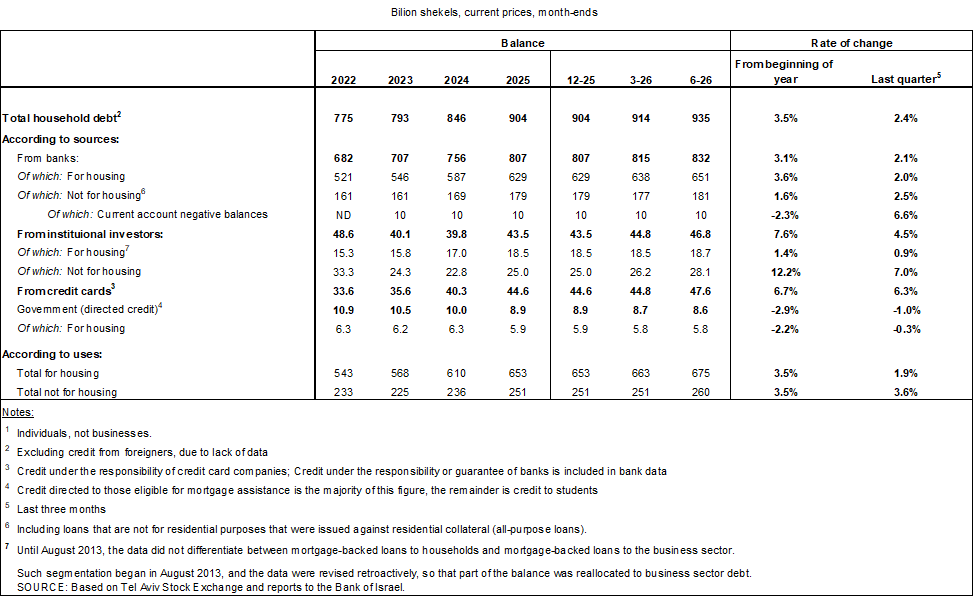
Figure 5: Rates of Change in Households’ Housing and Nonhousing Debt, Current
Quarter vs. Corresponding Quarter of Previous Year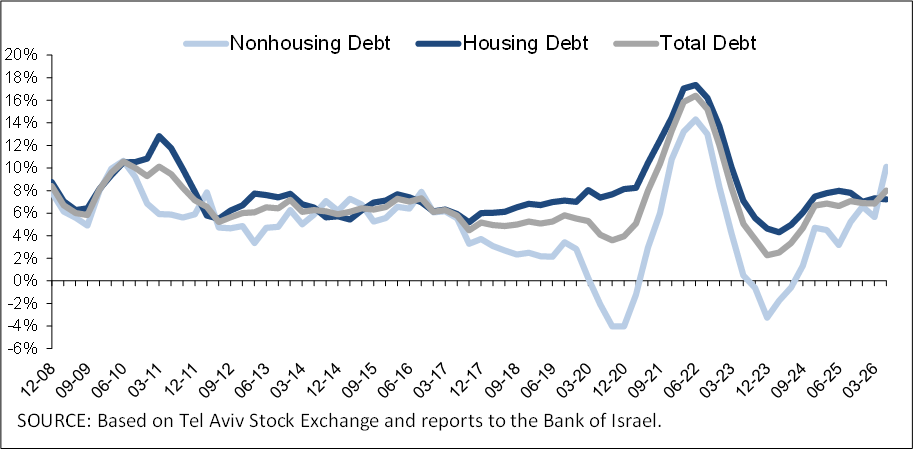
Figure 6 :Amount of New Home Purchase Loans Provided by Banks to the Public (Mortgages)
Links to Data and Statistics on the Bank of Israel website:
[1] Israeli corporations, excluding banks, credit card companies, and insurance companies.
[2] Balances indexed to the CPI are calculated according to the CPI known at the time the financial statements are prepared. As such, a change in the CPI relates to changes between the known CPI and the CPI of the preceding month.
[3] The change in the spread from one quarter to the next is calculated as the difference between the average spread in the final month of the reviewed quarter and the average spread in the final month of the previous quarter.